Where is the weather most variable?
My PhD is about the predictability of the weather. To me, predictability means the rate of ensemble spread. Ensemble spread is how quickly computer simulations starting with similar weather disagree with each other. You could also think about it as how predictable a robot would find the weather.
But what about people? What might a person consider a place with predictable weather?
My answer is a place where the weather tends to be what you expect for that month and time of day. In mathematical terms, where the monthly standard deviation is small.
In this post I will show what that standard deviation looks like for a few weather variables, in a part 2 I will combine these maps to show where I think you would find the weather predictable if you lived there.
I decided to summarise the weather in 3 variables, the surface wind kinetic energy (how hard the wind is blowing), the total precipitation (how much it rained) and the surface temperature. For each of these fields I will show the yearly average for 2021 and then the variability. There will also be a top 10 list of the countries that scored high and low in variability.
Surface Temperature:
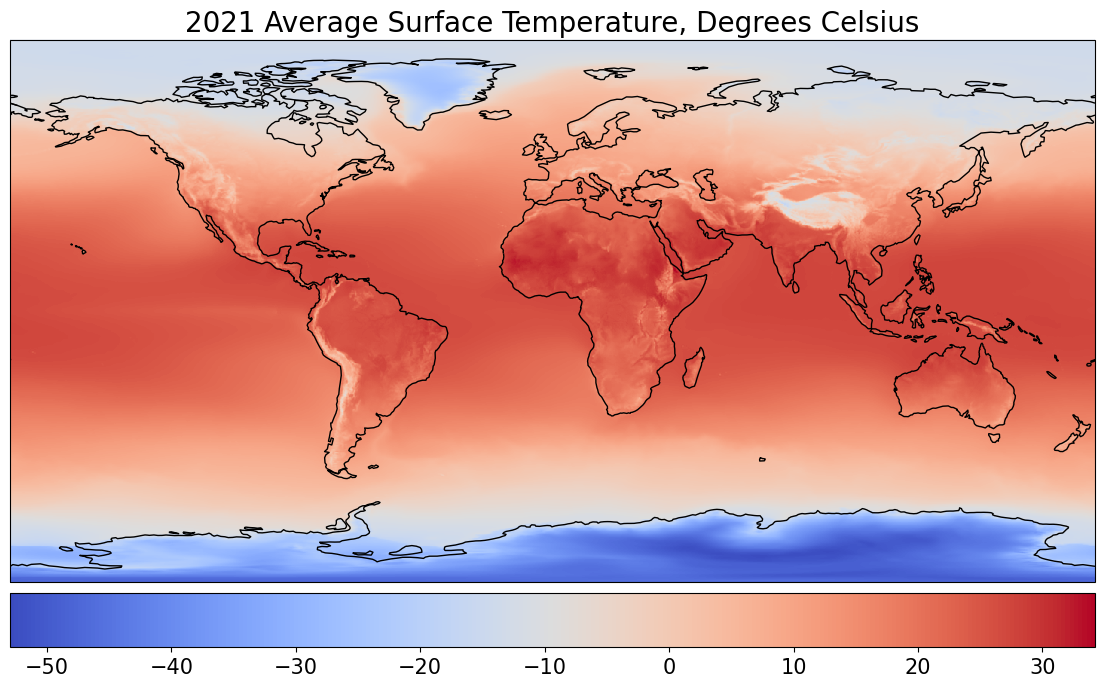
This is the average temperature across the globe in degrees Celsius for 2021. All of the following analysis is done on that single year. As with all the other maps I generated, I took 4 times, UTC 0, 6, 12 and 18 and averaged my results in order to eliminate day and night effects. So although the temperature in the Sahara varies a lot between the day and night, it is only variations between the same time of day that matter.
As expected, the hottest regions are those facing the sun around the equator. You can also see that terrain with greater altitude has a cooler surface temperature due to the lower air pressure.
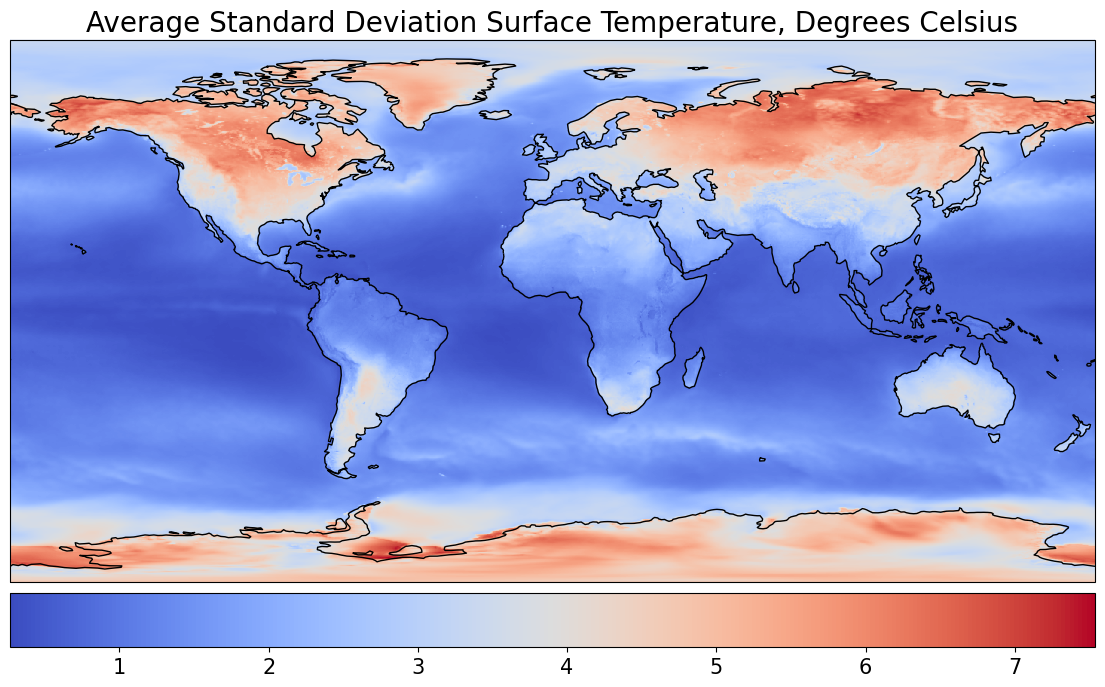
To generate the variability, I sorted the data into the 12 months and found the standard deviation for each. I then averaged these 12 values (and averaged with the result from the 4 other UTC times) to get an "Average Standard Deviation".
I chose to rank countries by the maximum average deviation in their borders (another valid alternative would be to use a country wide average). I must also add that some countries were too small for me to get meaningful results with the resolution of data I had, so unfortunately, they have been excluded. With that said, let’s see our first top 10 list!
Top 10 countries with the most variable temperature:
- Russia

- USA

- Canada

- Kazakhstan

- Greenland

- Mongolia

- China

- Finland

- Uzbekistan

- North Korea

Northern countries fared well here. This is because the inhabited land mass in the northern hemisphere is closer to the poles than in the south (excluding Antarctica which isn't a country but would place second if it was ranked). This is important because colder areas have more potential to increase in temperature than warmer ones and so can experience greater variations.
The sea acts as a temperature regulator as it has a greater heat capacity than the land. This means that locations far from coastlines tend to have greater variability.
Top 10 countries with the least variable temperature:
- Gambia

- Grenada

- Singapore

- Sint Maarten

- Glorioso Islands

- Gibraltar

- Northern Mariana Islands

- French Polynesia

- South Georgia and South Sandwich Islands

- Faroe Islands

As we would expect, those locations that are the inverse of the most variable were the least variable. Locations close to the sea and generally in warmer places. The last two entries are surprising as although they are islands like many of the other entries, they have high latitudes.
Total Rainfall:
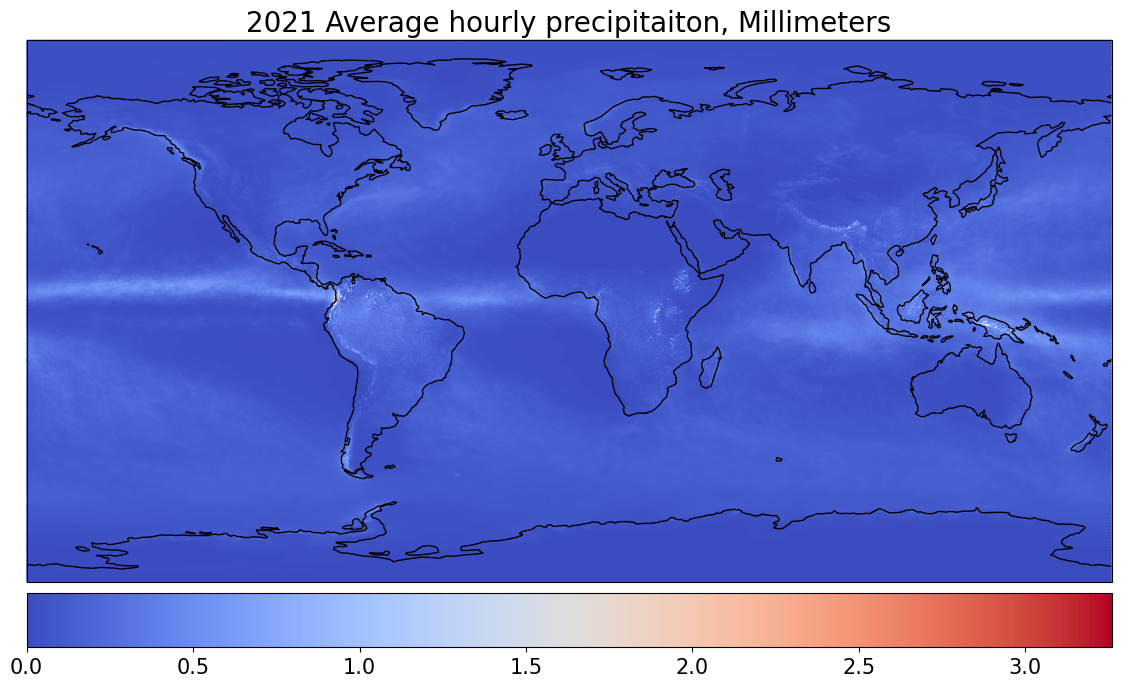
Precipitation (rain, snow etc) is due to moisture in the air condensing into droplets heavy enough to fall. This usually requires some nucleation centre, a particle around which condensation can occur. Aerosols, by which I mean dust, pollen or ocean salt, often perform this function and allow it to rain. That is why you can see more rain over the Amazon and other forested areas.
This is an interesting map because we can see so much meteorology at play. For example, notice the mountain ranges. There is often a dry and wet side of a mountain range as moist air is forced to a higher altitude as it passes over the higher land. This causes water to be rained out.
If you squint at the map, it looks like a white line at the equator with two dark bands above and below it. What we are seeing here is called the Hadley cell. Air is warmed at the equator causing it to rise, bringing with it moisture which condenses into precipitation as the pressure decreases. This air moves north and south until it sinks back to earth. (It doesn't go all the way to the poles due to the rotation of the Earth.) In these regions where air is sinking, precipitation is repressed and we see many of the world's deserts.
There are many more interesting features of the map such as the storm tracks and that 2021 was a La Nina year, meaning Indonesia and Australia had more rain than usual but we will leave it there for now.
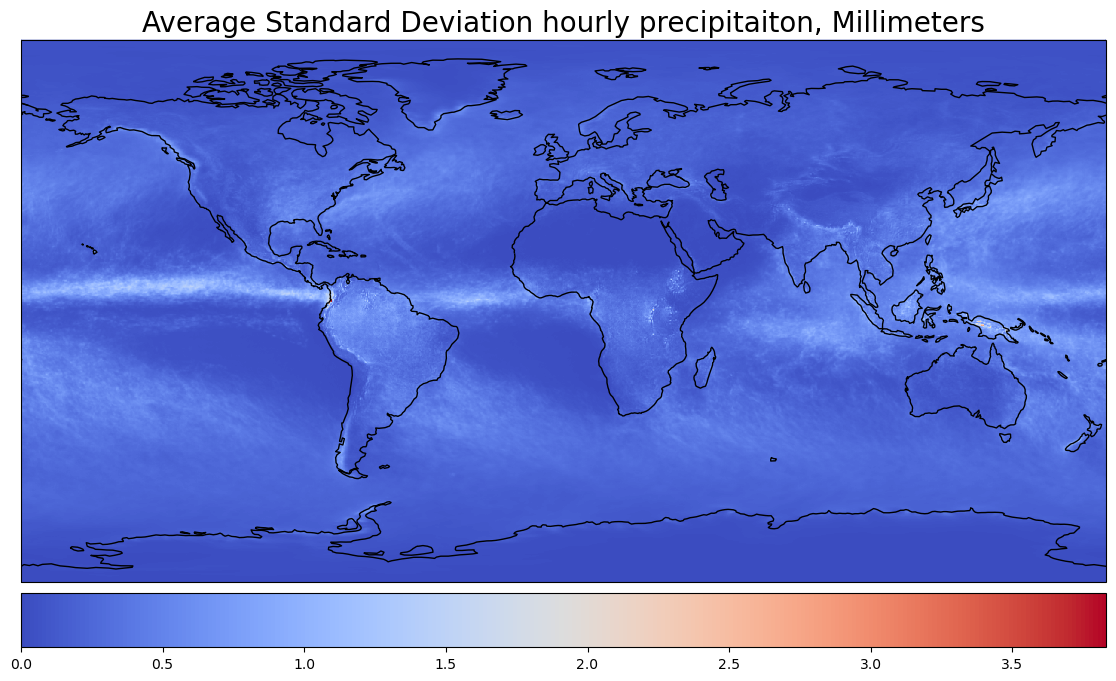
As expected, regions with more rain have more variability.
Top 10 countries with the most variable precipitation 2021:
- Colombia

- Indonesia

- Papua New Guinea

- Malaysia

- New Zealand

- Ecuador

- Brazil

- Venezuela

- Philippines

- Solomon Islands

La Nina and El Nino are two possible states the climate in the Pacific can be in, they can stay in one state or the other for several years. 2021 is La Nina (and at the time of writing that is still the state) which means there is more rainfall over the maritime continent than average. That means that if a longer time average was taken, Indonesia may drop a few places.
Top 10 countries with the least variable precipitation 2021:
- Qatar

- United Arab Emirates

- Kuwait

- Jordan

- Turkmenistan

- Djibouti

- Libya

- Oman

- Mauritania

- Egypt

Wind Speed:
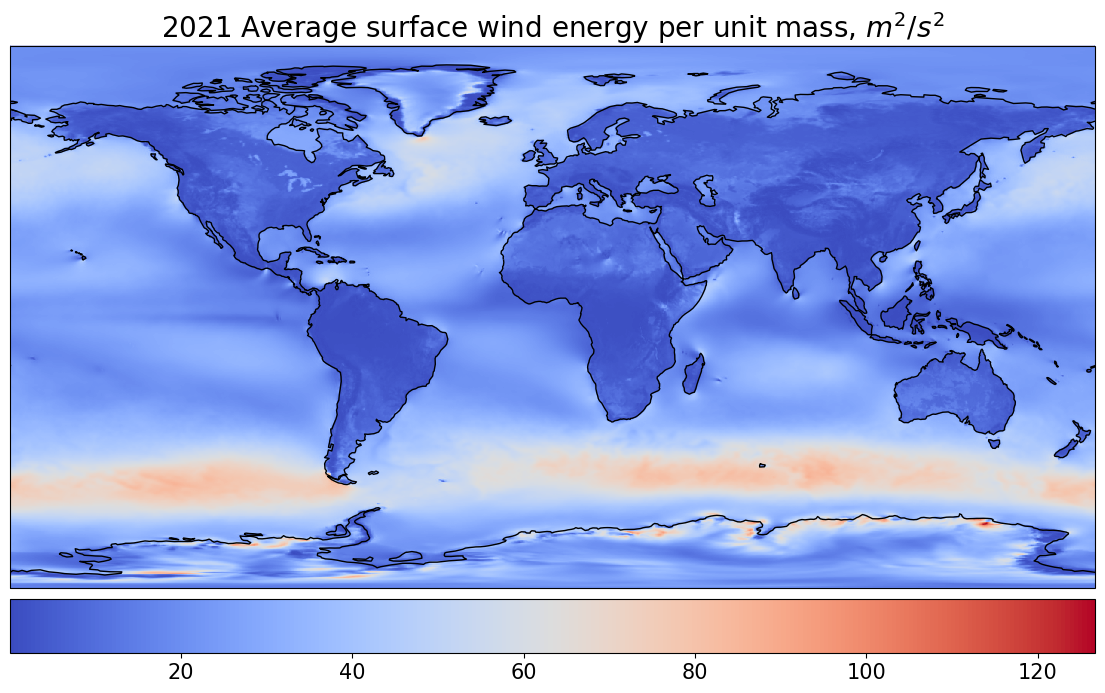
Kinetic energy is energy associated with motion. On the scale shown, 10 is a gentle breeze (leaves move), 60 is a strong breeze (large branches sway) and 100 corresponds to a moderate gale (whole trees sway).
Land resists the motion of the air more than the ocean so wind speeds tend to be lower over land than sea. The fastest surface winds happen around the Antarctic where there is a region almost free of land drag.
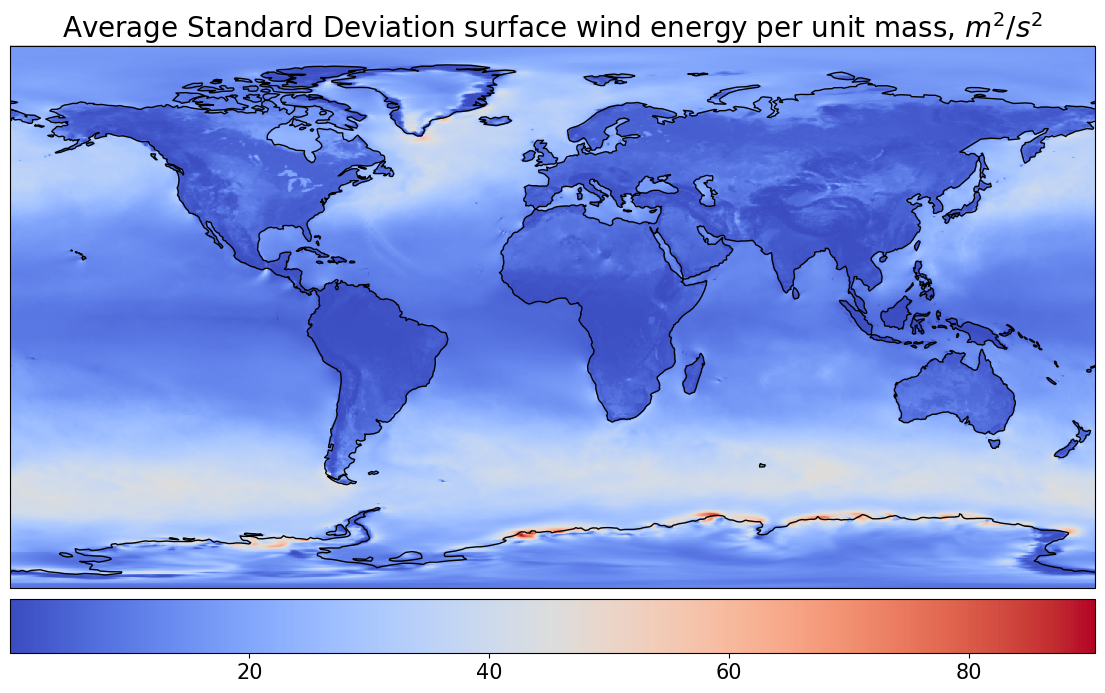
Top 10 countries with the most variable wind speed:
- Greenland
- Chile

- French Southern Territories

- Iceland

- United Kingdom

- Australia

- Norway

- Canada
- Ireland

- Russia
Top 10 countries with the least variable wind speed:
- Micronesia

- Saint Kitts and Nevis

- Gambia

- Saint Martin

- French Polynesia

- Madeira

- Saint Pierre and Miquelon

- Saint Vincent and the Grenadines

- Samoa

- Faroe Islands

Next in this series:
Where do people find the weather hardest to predict?
Final thoughts:
Look how awesome the Saint Pierre and Miquelon flag is!

These maps were generated in Python using ERA5 data from Copernicus. The data had a quarter degree resolution.
This post was inspired by an interesting article that used US weather station data to try and answer what state had the most capricious weather. I decided to make the global version.
Muñoz Sabater, J., (2019): ERA5-Land hourly data from 1981 to present. Copernicus Climate Change Service (C3S) Climate Data Store (CDS).


Comments ()